I was trying to profile a dll by launching it into another process, but when the profiler report was done it didn't have any references to my code - as if the dll was never instrumented. I finally started looking at the output window where I noticed something odd - the profiler was instrumenting the dll in obj\debug instead of bin\debug.
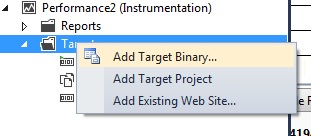
When using the profiler wizard, it promps you to chose which projects you want instrumented. In doing so, it looks like it decides to use the obj\bin output which of course the external exe never sees. The fix seemed to be to explicity add the dll instead of adding the project:

If you've reading this you've probably been to several sites already and are just about ready to kill something. Why Oracle couldn't print the name of the parameter that you attepted to bind is beyond me, but after all this is a company that was very recently recommending "locator varibles." I'll be honest and say there is no magic bullet here. Compared to Sql Server's Profiler, Oracle's statement tracing functionality is not developer friendly and the ODP client side tracing is pretty worthless. I can really only give some tips for things to look for and some brute force debugging tactics.
To be clear, this is with Oracle's data provider (Oracle.DataAccess.Client) and not Microsoft's Oracle provider (System.Data.OracleClient). The Microsoft provider is being deprecated so it is not recommended that you follow some of the older suggestions of simply switching providers.
In short, this error is a catch all for some sort of mismatch between the parameters referenced in the command text, and the parameters added to the command object. To start there's a couple of simple things to look for:
- Missing Comma - This one annoys the crap out of me. Forget a comma between constant values in an insert statement, and you'll get a nice "missing comma" error. However, forget a comma between bind variables and you'll get the error in question. My guess is that some genius decided to look only for an operator to terminate a bind variable and didn't consider whitespace.
- The number of parameters match - This one is an important one and an easy one. We just ran into a problem where a misnamed command variable was causing an extra parameter to be added that we werent seeing. I simple cmd.Parameters.Count in the watch window would have quickly told us there were more params in the collection than were in the statement.
- The order of the parameters match - Despite the warm fuzzy you might get when your parameter names match what is in your statement, those names do nothing by default. The default functionality is to bind the parameters in the order they are added. You can change this by setting OracleCommand.BindByName = true;
- Use OracleCommand.BindByName=true if you use the same parameter twice. This is a bit of assumption since I've not tested to confirm it, but I assume that because the default functionality is to bind by order, duplicated parameters would also need to be duplicated on the command object if BindByName is left as false.
- The type of the parameters match - The type parameter needs to match the type in the database. There is a little bit of flexibility with this with types like numerics (excluding overflow errors, OracleDbType.Int32 can be used in place of OracleDbType.Int64), but if you got lazy and defined parameter as OracleDbType.Varchar2 when you've got a Date column you might get this error. Generally I just use the Parameters.Add overload that takes variable name and value and let oracle decide on the type. This however does not work on output parameters - I set both the type and the length (at least for varchars) for those.
If the above eye-ball debugging doesn't work, I suggest that you start trimming down your statement and params until you get a successful execution and then work backwards from there. I know that's not much to go with but if I find something else I'll be sure to post it.
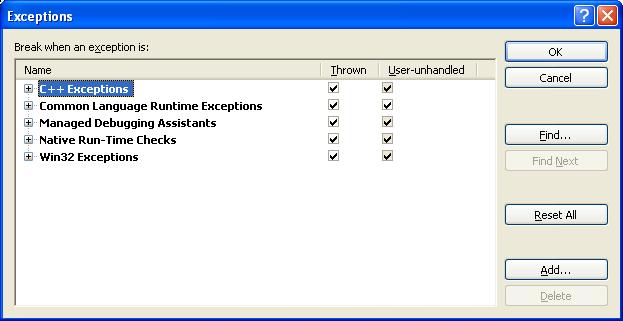
Every once in a while I'll have an app crash without any warning at all. One minute it's there, one minute it's not. No exception message, no break in visual studio while debugging, nothing. Each time this happens I just allow visual studio to catch 'thrown' exceptions rather than just 'user-unhandled' exceptions. This means that visual studio will break right at the time it occurs, rather than letting it bubble up to see if it will be handled later in the code. Go to File>Debug>Exceptions and check the 'Thrown' boxes...
