I was trying to profile a dll by launching it into another process, but when the profiler report was done it didn't have any references to my code - as if the dll was never instrumented. I finally started looking at the output window where I noticed something odd - the profiler was instrumenting the dll in obj\debug instead of bin\debug.
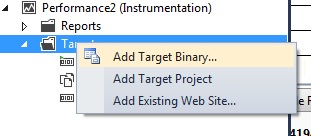
When using the profiler wizard, it promps you to chose which projects you want instrumented. In doing so, it looks like it decides to use the obj\bin output which of course the external exe never sees. The fix seemed to be to explicity add the dll instead of adding the project:
Once I started using Visual Studio 2010, I could no longer attach to nunit to debug my tests. Instead I found that I had to attach to nunit-agent.exe instead. Up till now this was a non-issue. However, some performance profilling methods require a start-up app, and nunit starting it's own process was confusing it so I was forced to find the reason for this new process.
It turns out it's because nunit by default is set to run under the 2.0 framework and it needs to run a separate process in order to test 4.0 assemblies. The good news is that you can force nunit to run under 4.0 with this change to your nunit.exe.config:
<startup>
<requiredRuntime version=”v4.0.30319″ />
</startup>
You can verify the before and after effect by looking at Tools -> Test Assemblies in nunit.