This week I had a query go south in terms of performance. I just tuned the thing a couple of months ago and it was running inside of a couple of seconds (it took two shots at a table that had 2.5 million rows). Now it was running as long as 3 minutes. Because part of the query is not date limited, it is going to deteriorate over time. However after confirming that the execution plan was roughly the same as it was before, I went to the DBA who saw a weird wait on “cache buffers chain latches” for a very small, 700 row table. That didn’t help me and it just sounded like some crazy internal Oracle-ism.
I spent some more time looking for additional index options or changing the specs for the query. The DBAs did suggest a compressed index since two columns were fairly non-unique which did help slightly. Another option was to limit the entire query to a date range. However after a while I thought I was going down the wrong path. It just didn’t seem reasonable that it got so bad so quickly so I felt like I was getting ahead of myself.
I started playing with different date ranges (part of the query IS date limited), I noticed querying only the most recent data was slow. Earlier ranges ran as expected (in a second or two) and the execution plan was had a different order to the joins. Here I realized that new data is loaded in batches and the stats were probably skewed because of it. Sure enough, the query started running normally after the DBA updated the stats for the schema.
Of course, I could have talked about updating stats in about two sentences so this is not the end of the story. But the DBA likes to argue almost as much as I do so it got more interesting from here. The DBA agreed that the stats were a reasonable fix, but he didn’t understand the wait on the “chain latches.” He didn’t think it should be waiting on anything. I argued that the change in join order was causing a 2.5M x700 row loop (vs. maybe a 200K x 700 loop) so a wait on the smaller table makes sense considering it’s being scanned at a ratio of 700:1. I thought if you checked the tool enough you had a 1 in 700 chance in seeing the same type of wait on the other table.
We agreed to disagree on the details but I admittedly didn’t know what this mysterious “latch” thing was, so of course I google’d it and found an article from “orainternals”. Inside is a lot of Oracle DBA stuff that I probably don’t have access to but toward the bottom of the article it said this:
From these two different techniques, we can find objects common to both steps 1 and 2 and those objects are probable candidates to focus on. We see that ORDER table is common to both techniques. From the plan above, ORDER table is accessed in a tight nested loops join. This will increase buffer access to ORDER table, in turn, resulting in higher latching activity.
SQL tuning: That was easy
From here onwards, solution is straightforward, we need to avoid tight nested loops join.
I looked at the old and new execution plans. Sure enough, the joins went from nested loops to hash and merge joins…
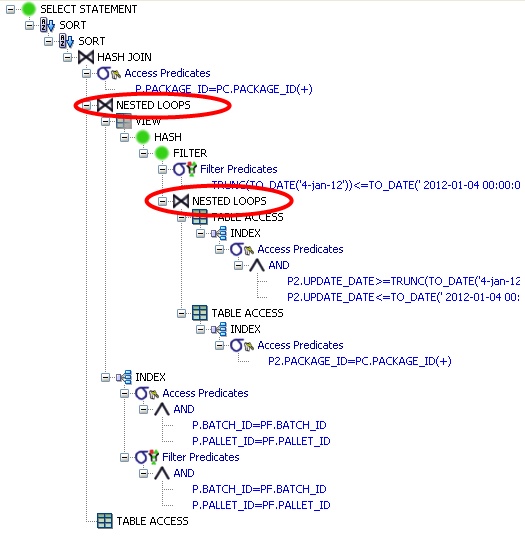
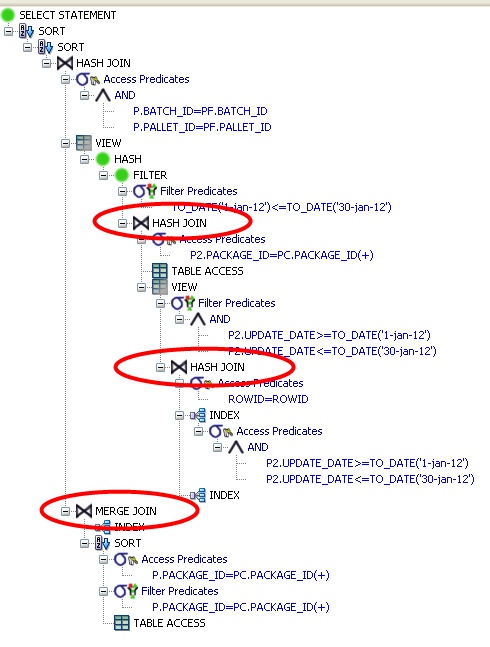
Unlike a nested loop join which runs thru the small table for EVERY row in the large table, a hash join just takes one pass at the small table during the “build phase” when the hash table is created. Consequently the small table was getting hit 1 time vs 2.5 million times.
I’m not to the point quite yet where I can comment why the optimizer chose the different join types other than generally blaming it on the stats. However it was one of very few times I was hit with the mechanics of an execution plan beyond index manipulation. Before, I wouldn’t have caught the join type as a pointer to the problem.